Feb 242020
 

This is the second part of my field report about installing the oVirt 4.4-alpha release on CentOS 8 in a hyperconverged setup. In the first part I was focusing on setting up the GlusterFS storage cluster and now I’m going to describe my experience of the self-hosted engine installation.

If you think about repeating this installation on your hardware please let me remind you: This software is currently in alpha status. This means there are likely still many bugs and rough edges and if you succeed to install it successfully there is no guarantee for updates not breaking everything again. Please don’t try this anywhere close to production systems or data. I won’t be able to assist you in any way if things turn out badly.

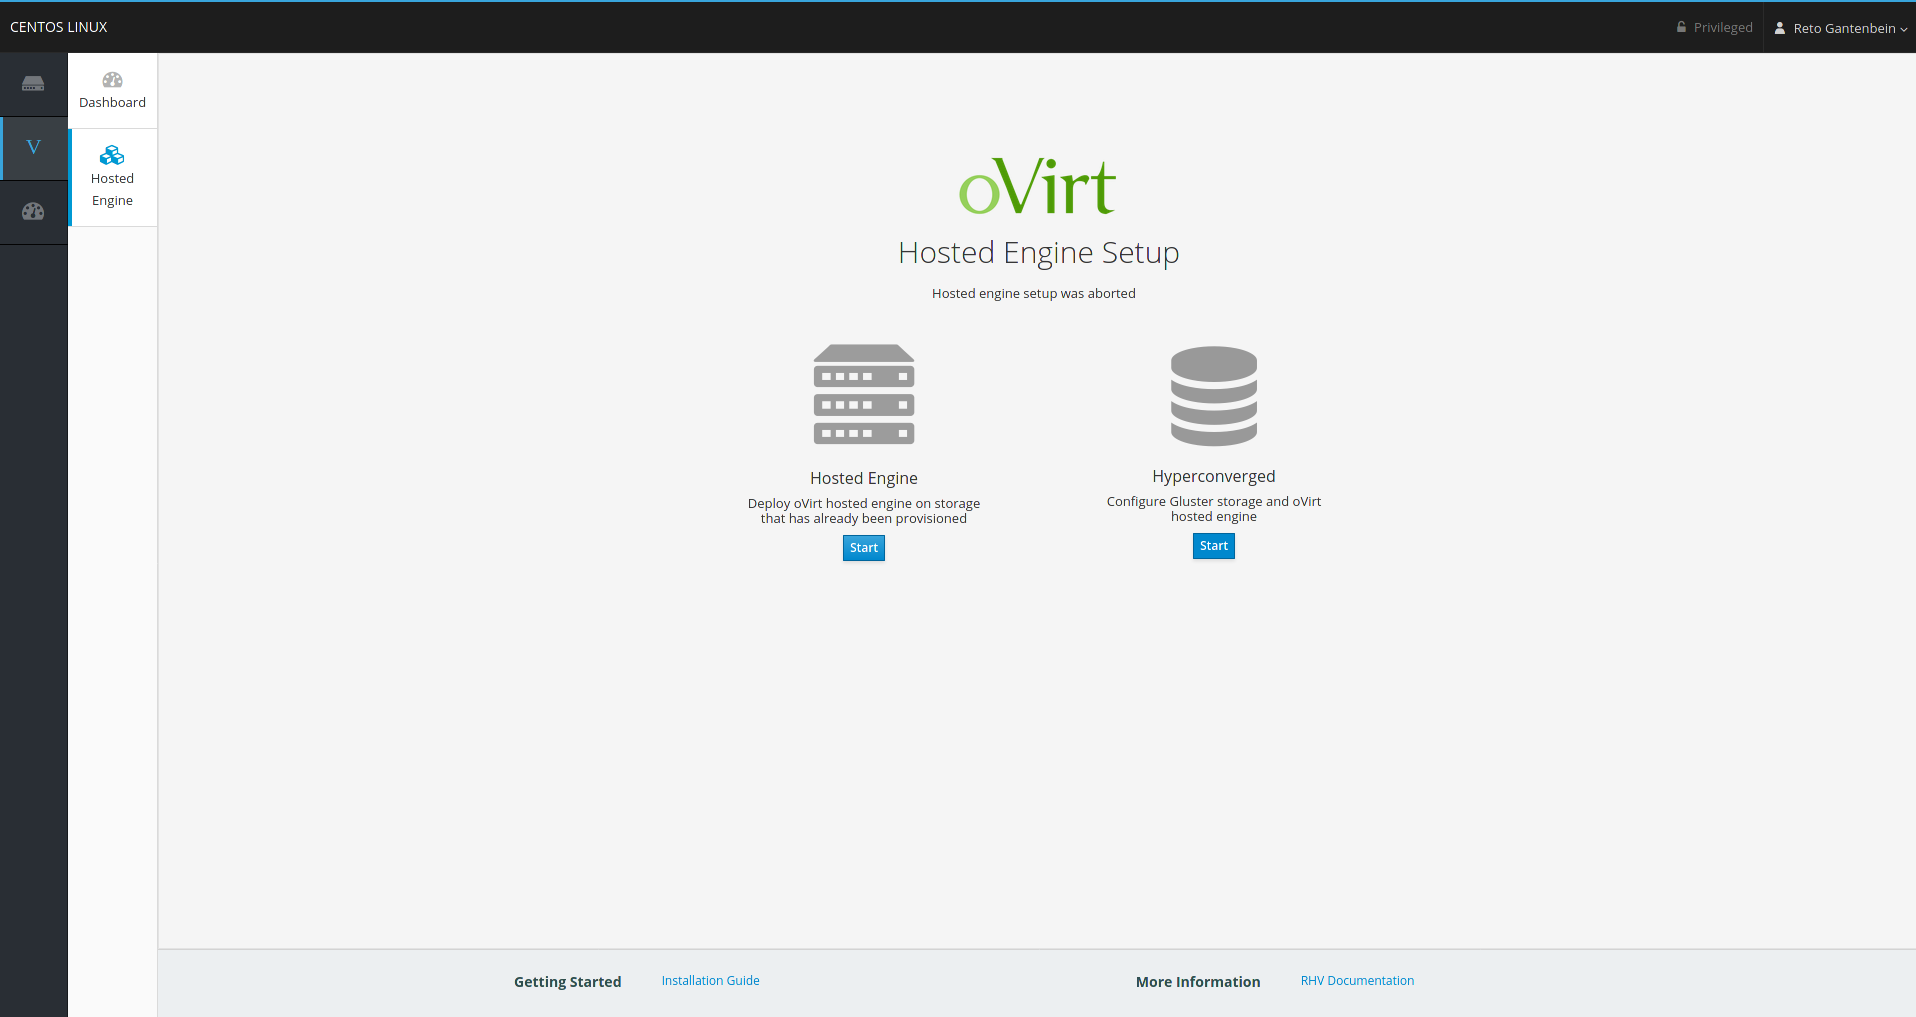
Cockpit Hosted-Engine Wizard

Before we can start installing the self-hosted engine, we need to install a few more packages:

# dnf install ovirt-engine-appliance vdsm-gluster

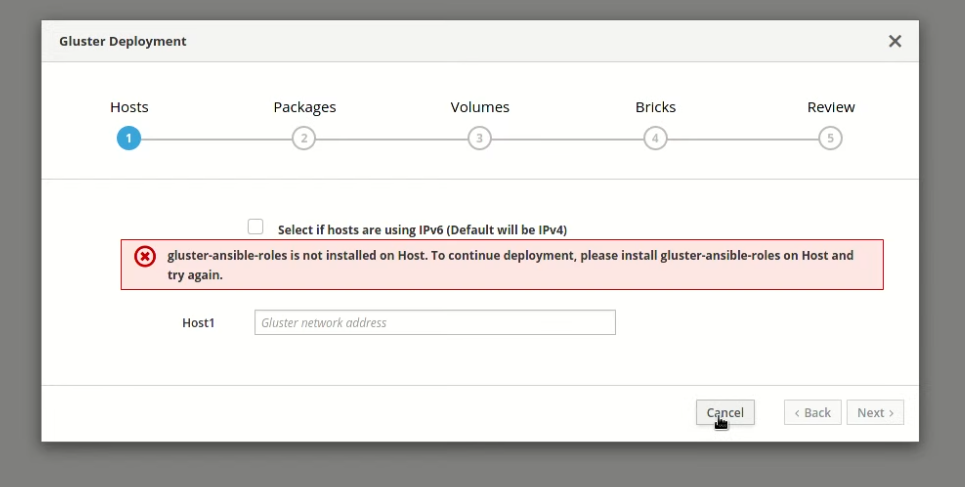
Similar to the GlusterFS setup, also the hosted engine setup can be done from the Cockpit Web interface:

The wizard is also here pretty self-explanatory. There are a few options missing in Web-UI compared to the commandline installer (hosted-engine --deploy) e.g. you cannot customize the name of the libvirt domain which is called ‘HostedEngine’ by default. You must give the common details such as hostname, VM resources, some network settings, credentials for the VM and oVirt and that’s pretty much it:

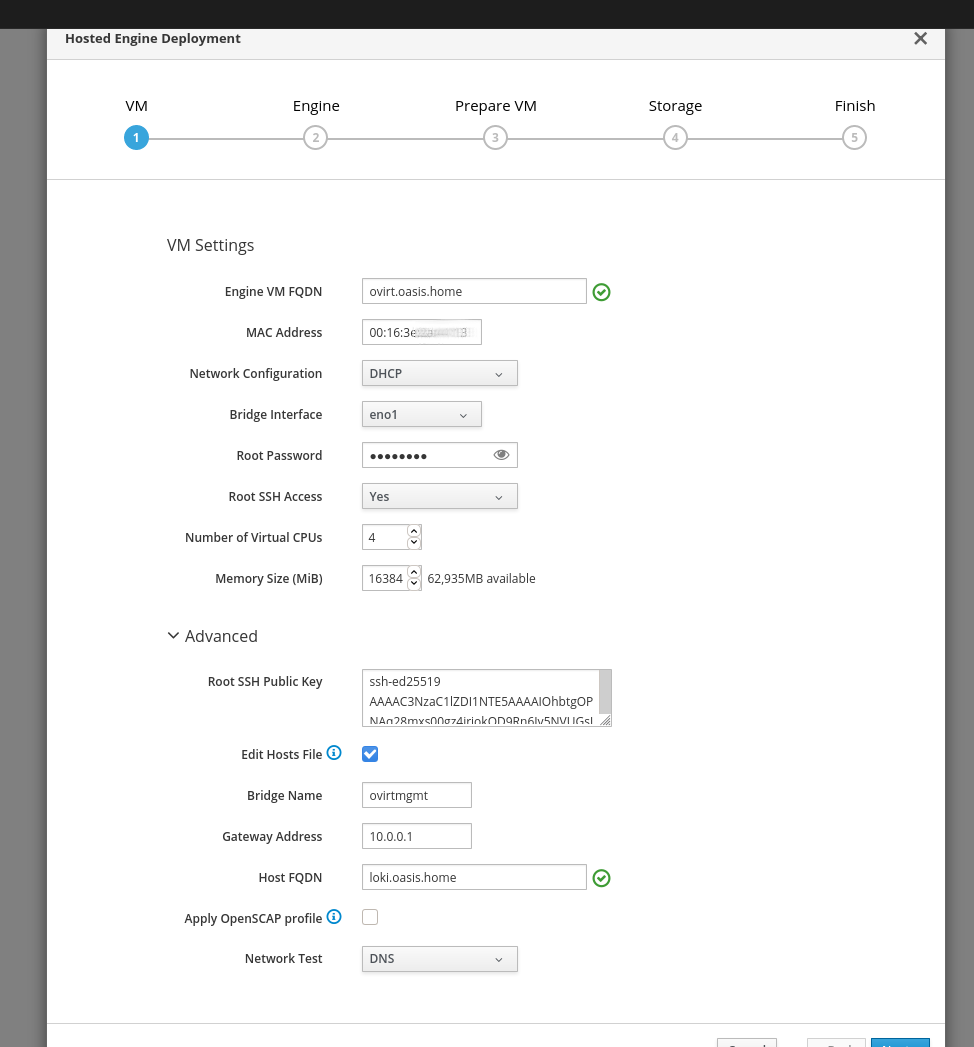
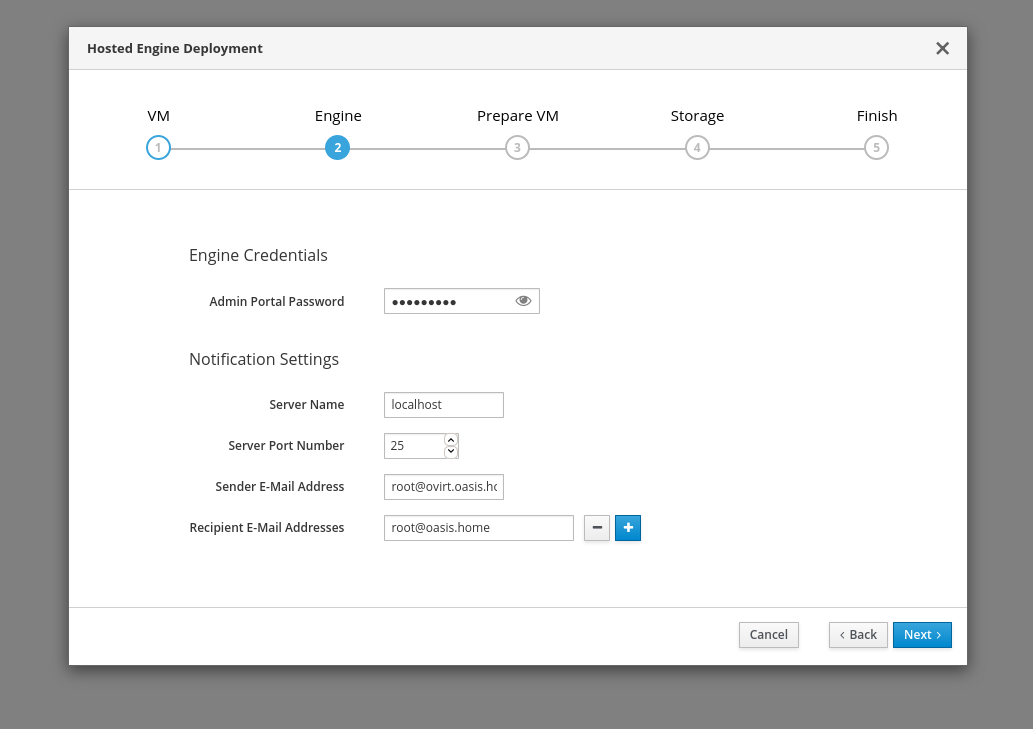
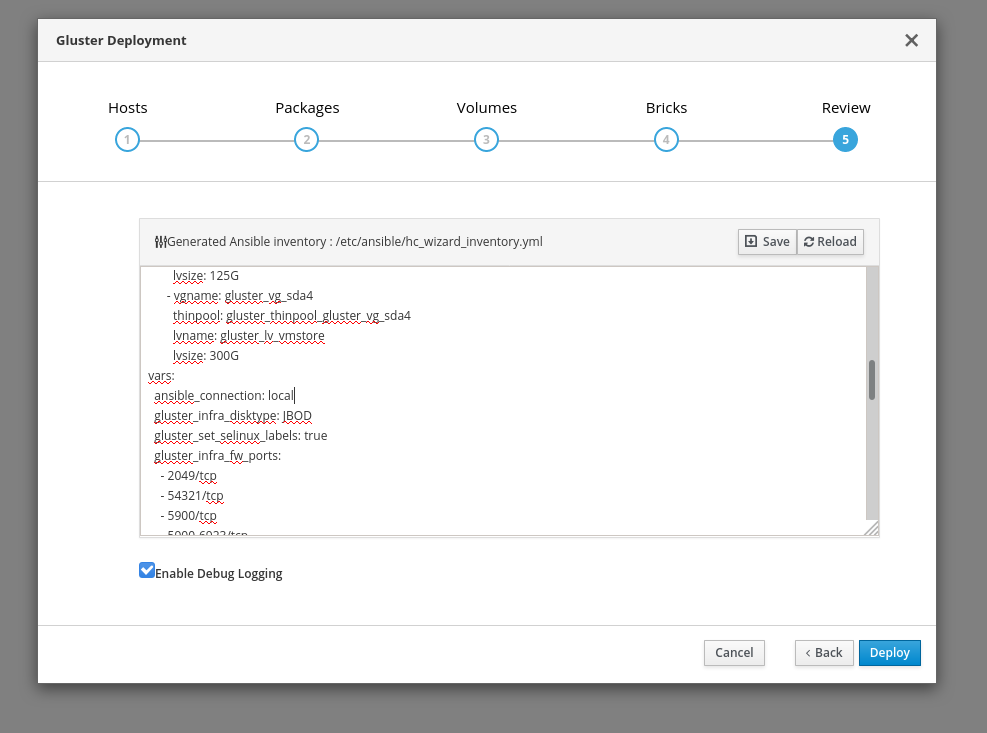
Before you start deploying the VM there is also a quick summary of the settings and then an answer file will be generated. While the GlusterFS setup created a regular Ansible inventory the hosted engine setup has its own INI-format. It’s a useful feature that even when the deployment aborts, it can always be restarted from the Web interface without the need to fill in the form again and again. Indeed, I used this to my advantage a lot because it took me at least 20 attempts before the hosted engine VM was setup successfully.

Troubleshooting hosted-engine issues

Once VM deployment was running I found that the status output in the Cockpit Web interface heavily resembled Ansible output. It seems that a big part of the deployment code in the hosted-engine tool was re-implemented now using the ovirt-ansible-hosted-engine-setup Ansible roles in the background. If you’re familiar with Ansible this definitely simplifies troubleshooting and also allows a better understanding what is going on. Unfortunately there is still a layer of hosted-engine code above Ansible so that I couldn’t figure out, if it’s possible to run a playbook from the shell that would do the same setup.

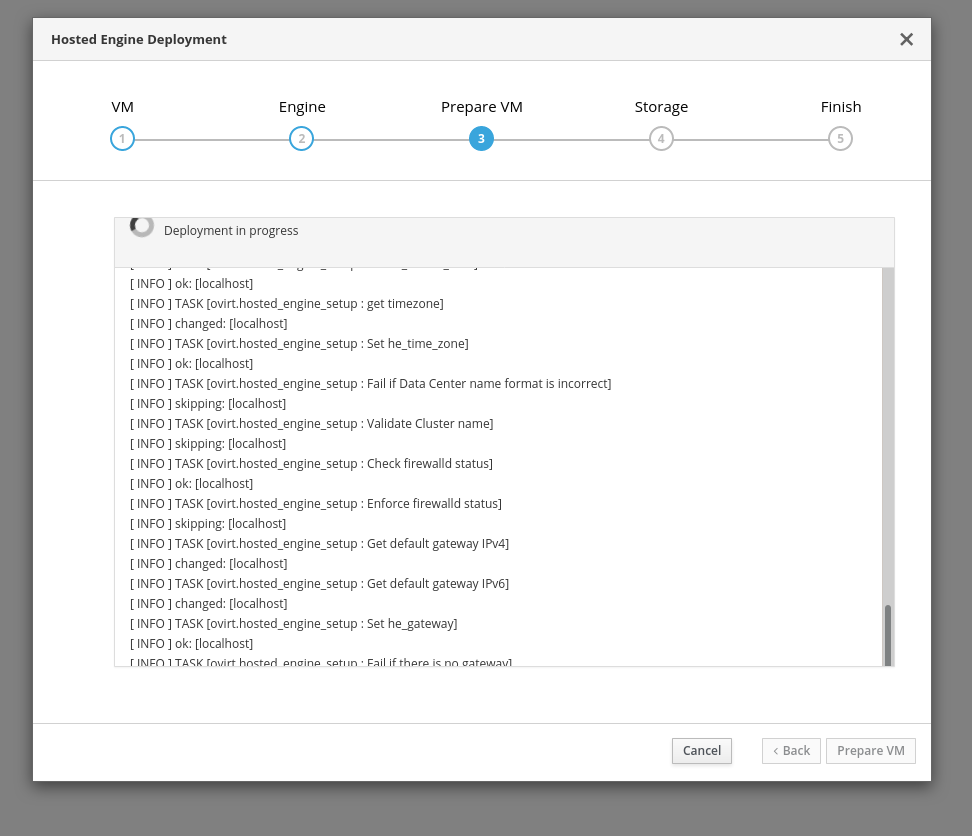
Obviously it didn’t take long for an issue to pop-up:

  • The first error was that Ansible couldn’t connect to the hosted-engine VM that was freshly created from the oVirt appliance disk image. The error output in the Web interface is rather limited but also here a log file exists that can be found at a path like /var/log/ovirt-engine/setup/ovirt-engine-setup-20200218154608-rtt3b7.log. In the log file I found:
    2020-02-18 15:32:45,938+0100 DEBUG ansible on_any args localhostTASK: ovirt.hosted_engine_setup : Wait for the local VM kwargs 
    2020-02-18 15:35:52,816+0100 ERROR ansible failed {
        "ansible_host": "localhost",
        "ansible_playbook": "/usr/share/ovirt-hosted-engine-setup/ansible/trigger_role.yml",
        "ansible_result": {
            "_ansible_delegated_vars": {
                "ansible_host": "ovirt.oasis.home"
            },
            "_ansible_no_log": false,
            "changed": false,
            "elapsed": 185,
            "msg": "timed out waiting for ping module test success: Using a SSH password instead of a key is not possible because Host Key checking is enabled and sshpass does not support this.  Please add this host's fingerprint to your know
    n_hosts file to manage this host."
        },
        "ansible_task": "Wait for the local VM",
        "ansible_type": "task",
        "status": "FAILED",
        "task_duration": 187
    }

    A manual SSH login with the root account on the VM was possible after accepting the fingerprint. Maybe this is still a bug or I missed a setting somewhere, but the easiest way to solve this was to create a ~root/.ssh/config file on the hypervisor host with the following content. The hostname is the hosted-engine FQDN:

    Host ovirt.oasis.home
        StrictHostKeyChecking accept-new
    

    Each installation attempt will make sure that the previous host key is deleted from the known_hosts file so no need to worry about changing keys on multiple installation tries. The deployment could simply be restarted by pressing the “Prepare VM” button once again.

  • During the next run the connection to the hosted-engine VM succeeded and it nearly completed all of the setup task within the VM but then failed when trying to restart the ovirt-engine-dwhd service:
    2020-02-18 15:48:45,963+0100 INFO otopi.plugins.ovirt_engine_setup.ovirt_engine_dwh.core.service service._closeup:52 Starting dwh service
    2020-02-18 15:48:45,964+0100 DEBUG otopi.plugins.otopi.services.systemd systemd.state:170 starting service ovirt-engine-dwhd
    2020-02-18 15:48:45,965+0100 DEBUG otopi.plugins.otopi.services.systemd plugin.executeRaw:813 execute: ('/usr/bin/systemctl', 'start', 'ovirt-engine-dwhd.service'), executable='None', cwd='None', env=None
    2020-02-18 15:48:46,005+0100 DEBUG otopi.plugins.otopi.services.systemd plugin.executeRaw:863 execute-result: ('/usr/bin/systemctl', 'start', 'ovirt-engine-dwhd.service'), rc=1
    2020-02-18 15:48:46,006+0100 DEBUG otopi.plugins.otopi.services.systemd plugin.execute:921 execute-output: ('/usr/bin/systemctl', 'start', 'ovirt-engine-dwhd.service') stdout:
    
    
    2020-02-18 15:48:46,006+0100 DEBUG otopi.plugins.otopi.services.systemd plugin.execute:926 execute-output: ('/usr/bin/systemctl', 'start', 'ovirt-engine-dwhd.service') stderr:
    Job for ovirt-engine-dwhd.service failed because the control process exited with error code. See "systemctl status ovirt-engine-dwhd.service" and "journalctl -xe" for details.
    
    2020-02-18 15:48:46,007+0100 DEBUG otopi.context context._executeMethod:145 method exception
    Traceback (most recent call last):
      File "/usr/lib/python2.7/site-packages/otopi/context.py", line 132, in _executeMethod
        method['method']()
      File "/usr/share/ovirt-engine/setup/bin/../plugins/ovirt-engine-setup/ovirt-engine-dwh/core/service.py", line 55, in _closeup
        state=True,
      File "/usr/share/otopi/plugins/otopi/services/systemd.py", line 181, in state
        service=name,
    RuntimeError: Failed to start service 'ovirt-engine-dwhd'
    2020-02-18 15:48:46,008+0100 ERROR otopi.context context._executeMethod:154 Failed to execute stage 'Closing up': Failed to start service 'ovirt-engine-dwhd'
    2020-02-18 15:48:46,009+0100 DEBUG otopi.context context.dumpEnvironment:765 ENVIRONMENT DUMP - BEGIN
    2020-02-18 15:48:46,010+0100 DEBUG otopi.context context.dumpEnvironment:775 ENV BASE/error=bool:'True'
    2020-02-18 15:48:46,010+0100 DEBUG otopi.context context.dumpEnvironment:775 ENV BASE/exceptionInfo=list:'[(, RuntimeError("Failed to start service 'ovirt-engine-dwhd'",), )]'
    2020-02-18 15:48:46,012+0100 DEBUG otopi.context context.dumpEnvironment:779 ENVIRONMENT DUMP - END
    

    Fortunately I was able to login to the hosted-engine VM and found the following blunt error:

    -- Unit ovirt-engine-dwhd.service has begun starting up.
    Feb 18 15:48:46 ovirt.oasis.home systemd[30553]: Failed at step EXEC spawning /usr/share/ovirt-engine-dwh/services/ovirt-engine-dwhd/ovirt-engine-dwhd.py: Permission denied
    -- Subject: Process /usr/share/ovirt-engine-dwh/services/ovirt-engine-dwhd/ovirt-engine-dwhd.py could not be executed
    

    Indeed, the referenced script was not marked executable. Fixing it manually and restarting the service showed that this would succeed. But there is one problem. This change is not persisted. On the next deployment run, the hosted-engine VM will be deleted and re-created again. When searching for a nicer solution I found that this bug is actually already fixed in the latest release of ovirt-engine-dwh-4.4.0-1.el8.noarch.rpm but the appliance image (ovirt-engine-appliance-4.4-20200212182535.1.el8.x86_64) was only including ovirt-engine-dwh-4.4.0-0.0.master.20200206083940.el7.noarch and there is no newer appliance image. That’s part of the experience when trying alpha releases but it’s not a blocker. Eventually I found that there is a directory where you can place an Ansible tasks file which will be executed in the hosted-engine VM before the setup is run. So I created the file hooks/enginevm_before_engine_setup/yum_update.yml in the /usr/share/ansible/roles/ovirt.hosted_engine_setup/ directory with the following content:

    ---
    - name: Update all packages
      package:
      name: '*'
      state: latest
    

    From then on each deployment attempt was first updating the packages including ‘ovirt-engine-dwh’ in the VM before the
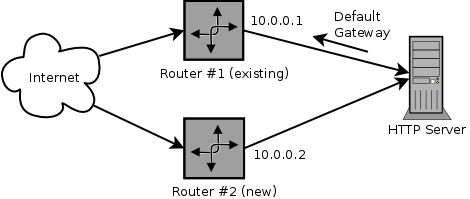
 hosted-engine would continue to configure and restart the service.

  • The next issue was suddenly appearing when I tried to re-run the deployment. The Ansible code would fail early with an error that it cannot update the routing rules on the hypervisor:
    2020-02-18 16:17:38,330+0100 DEBUG ansible on_any args  kwargs 
    2020-02-18 16:17:38,664+0100 INFO ansible task start {'status': 'OK', 'ansible_type': 'task', 'ansible_playbook': '/usr/share/ovirt-hosted-engine-setup/ansible/trigger_role.yml', 'ansible_task': 'ovirt.hosted_engine_setup : Add IPv4 outbo
    und route rules'}
    2020-02-18 16:17:38,664+0100 DEBUG ansible on_any args TASK: ovirt.hosted_engine_setup : Add IPv4 outbound route rules kwargs is_conditional:False 
    2020-02-18 16:17:38,665+0100 DEBUG ansible on_any args localhostTASK: ovirt.hosted_engine_setup : Add IPv4 outbound route rules kwargs 
    2020-02-18 16:17:39,214+0100 DEBUG var changed: host "localhost" var "result" type "" value: "{
        "changed": true,
        "cmd": [
            "ip",
            "rule",
            "add",
            "from",
            "192.168.222.1/24",
            "priority",
            "101",
            "table",
            "main"
        ],
        "delta": "0:00:00.002805",
        "end": "2020-02-18 16:17:38.875350",
        "failed": true,
        "msg": "non-zero return code",
        "rc": 2,
        "start": "2020-02-18 16:17:38.872545",
        "stderr": "RTNETLINK answers: File exists",
        "stderr_lines": [
            "RTNETLINK answers: File exists"
        ],
        "stdout": "",
        "stdout_lines": []
    }"
    

    So I was checking the rules manually and yes, they were already there. I thought that’s an easy case, that must be a simple idempotency issue in the Ansible code. But when looking up the code there was already a condition in place that should prevent this case from happening. Even after multiple attempts to debug this code, I couldn’t find the reason why this check is failing. Eventually I found the GitHub pull request #96 where someone was already refactoring this code with a commit message “Hardening existing ruleset lookup”. So I forward-ported the patch to the release 1.0.35 which fixed the problem. The PR is already open for more than a year with no indication that it would be merged soon, so I still reported the issue in ovirt-ansible-hosted-engine-setup #289.
    I only found out about ovirt-hosted-engine-cleanup a few hours later, so with its help you can easily work-around this issue by cleaning up the installation before another retry.

  • Another though to debug but easy to fix issue popped up after the hosted-engine VM setup completed and the Ansible role was checking the oVirt events for errors:
    2020-02-19 01:46:53,723+0100 ERROR ansible failed {
        "ansible_host": "localhost",
        "ansible_playbook": "/usr/share/ovirt-hosted-engine-setup/ansible/trigger_role.yml",
        "ansible_result": {
            "_ansible_no_log": false,
            "changed": false,
            "msg": "The host has been set in non_operational status, deployment errors:   code 4035: Gluster command [] failed on server .,    code 10802: VDSM loki.oasis.home command GlusterServersListVDS failed: The method does not exist or is not available: {'method': 'GlusterHost.list'},   fix accordingly and re-deploy."
        },
        "ansible_task": "Fail with error description",
        "ansible_type": "task",
        "status": "FAILED",
        "task_duration": 0
    }
    

    This error is not in the Ansible code anymore but the engine itself fails to query the GlusterFS status on the hypervisor. This is done via VDSM, a daemon that runs on each oVirt hypervisor and manages the hypervisor configuration and status. Maybe the VDSM log (/var/log/vdsm/vdsm.log) reveals more insights:

    2020-02-19 01:46:45,786+0100 INFO  (jsonrpc/7) [jsonrpc.JsonRpcServer] RPC call Host.getCapabilities succeeded in 3.33 seconds (__init__:312)
    2020-02-19 01:46:45,981+0100 INFO  (jsonrpc/1) [jsonrpc.JsonRpcServer] RPC call GlusterHost.list failed (error -32601) in 0.00 seconds (__init__:312)
    

    Seems that regular RPC calls to VDSM are successful but only the GlusterFS query is failing. I tracked down the source code of this implementation and found that there is a CLI command that can be used to run this query:

    # vdsm-client --gluster-enabled -h
    Traceback (most recent call last):
      File "/usr/lib/python3.6/site-packages/vdsmclient/client.py", line 276, in find_schema
        with_gluster=gluster_enabled)
      File "/usr/lib/python3.6/site-packages/vdsm/api/vdsmapi.py", line 156, in vdsm_api
        return Schema(schema_types, strict_mode, *args, **kwargs)
      File "/usr/lib/python3.6/site-packages/vdsm/api/vdsmapi.py", line 142, in __init__
        with io.open(schema_type.path(), 'rb') as f:
      File "/usr/lib/python3.6/site-packages/vdsm/api/vdsmapi.py", line 95, in path
        ", ".join(potential_paths))
    vdsm.api.vdsmapi.SchemaNotFound: Unable to find API schema file, tried: /usr/lib/python3.6/site-packages/vdsm/api/vdsm-api-gluster.pickle, /usr/lib/python3.6/site-packages/vdsm/api/../rpc/vdsm-api-gluster.pickle

    Ah, that’s better. I love such error messages. Thanks to that it was not so hard to find, that I actually overlooked to install the vdsm-gluster package on the hypervisor.

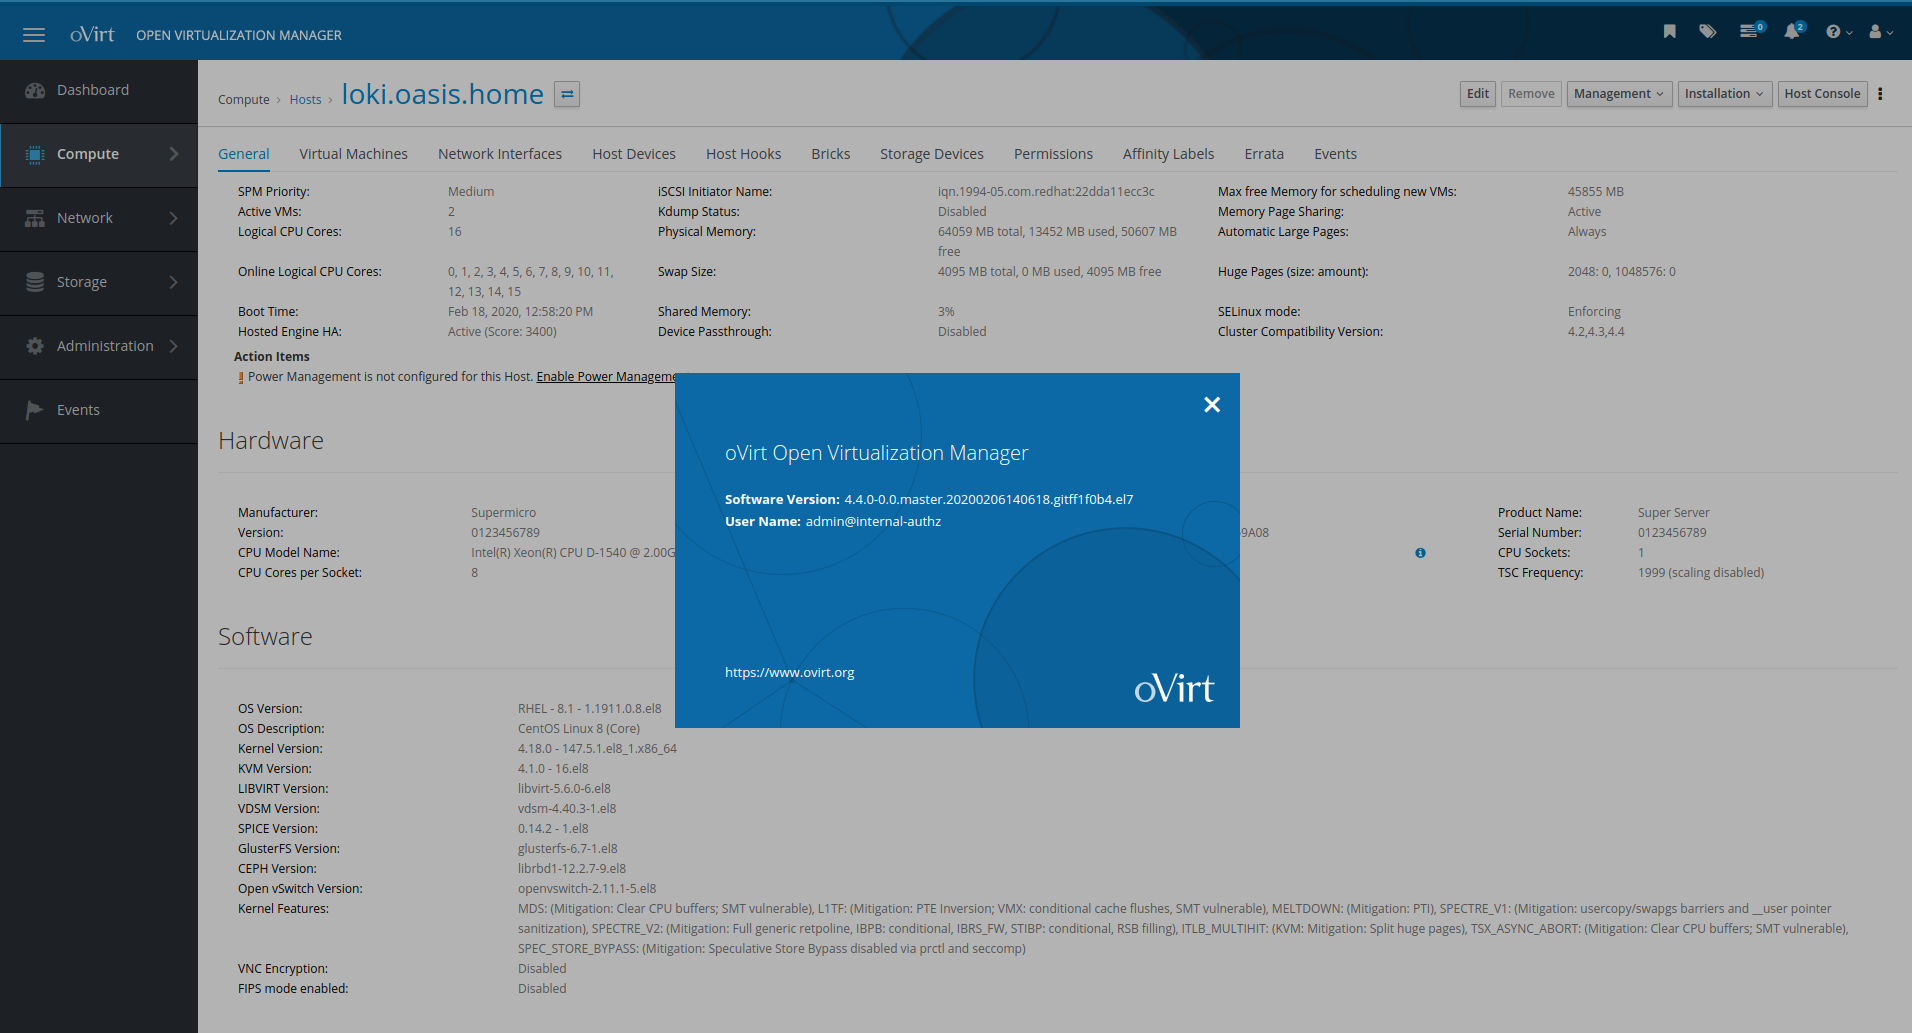
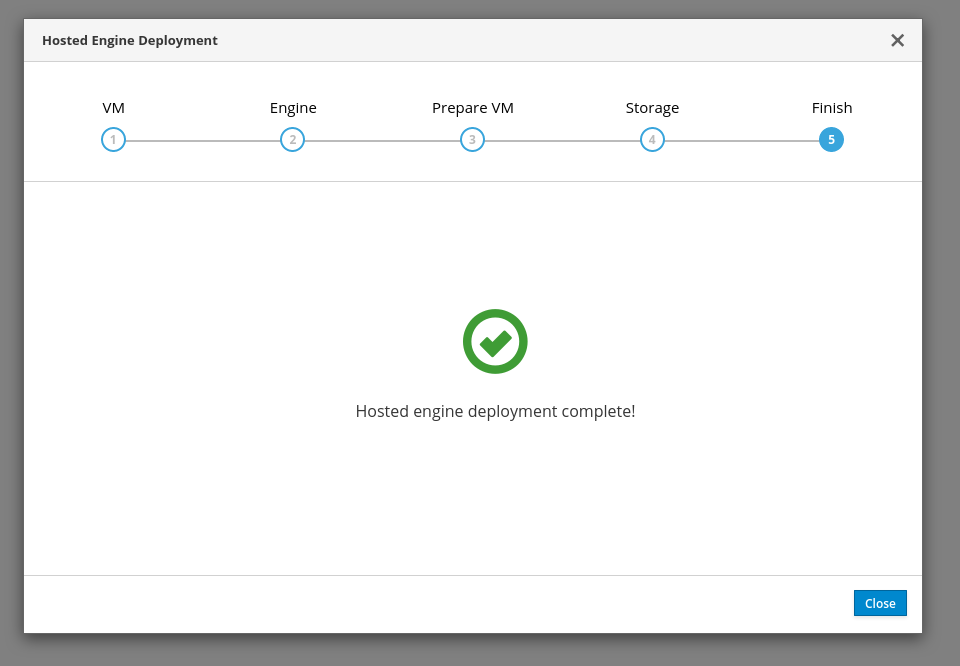
That’s it after that the deployment completed successfully:

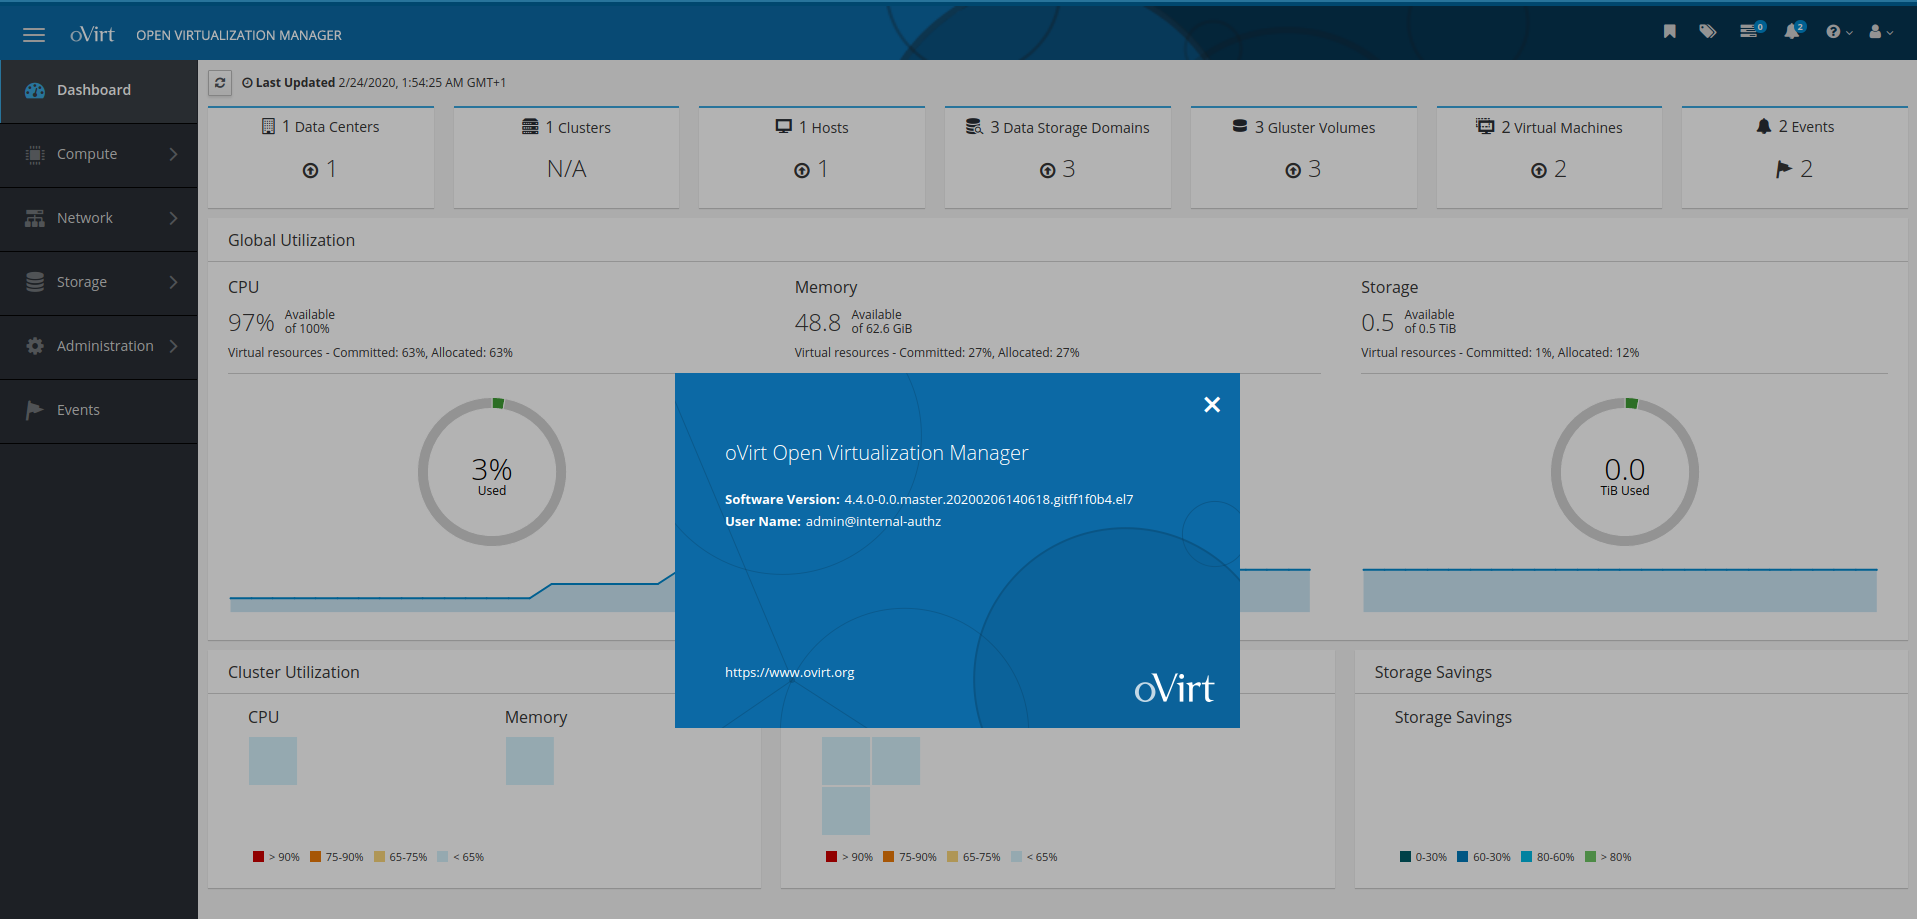
And finally a screenshot of the oVirt 4.4-alpha administration console. Yes, it works:

Conclusion

At the end the of the day most of the issues happened because I was not very familiar with the setup procedure and at the same time refused to follow any setup instructions for an older release. There were a minor bug with the ovirt-engine-dwh restart issue, that was already fixed upstream but didn’t made it yet into the hosted-engine appliance image. Something that is expected in an alpha release.

I also quickly setup some VMs to test the basic functionality of oVirt and couldn’t find any major issues so far. I guess most people using oVirt are much more experienced with it than me anyway, so there shouldn’t be any concerns in trying oVirt 4.4-alpha yourself. To me that was an interesting experience and I’m very happy about the Ansible integration that this project is pushing. It was also a nice experience to use Cockpit and I believe that’s definitely something that makes this product more appealing to setup and use for a wide range of IT professionals. As long as it can be done via command line too, I’ll be happy.

Feb 232020
 

For a while I had a oVirt server in a hyperconverged setup which means that the hypervisor was also running a GlusterFS storage server and that the oVirt management virtual machine was inside the oVirt cluster (self-hosted engine). On top of oVirt I was running a OKD cluster with a containerized GlusterFS cluster that could be used for persistent volumes by the container workload. All of this was running on a single hypervisor with a single SSD which unfortunately gave up on me after a few years in operation. Recently I stumbled upon the oVirt 4.4-alpha. Next to initial support for running it on CentOS 8 also a proper support for ignition that is used by (Fedora and Red Hat) CoreOS and therefore OpenShift/OKD 4 attracted my attention. Why not give it a try and see how far I come…? After a few hours of tinkering I succeeded the installation:

And now I’m going to describe what was necessary to do so. Not everything that I’ll mention is brand new. My past experience of setting up such a system is more or less based on the guide Up and Running with oVirt 4.0 and Gluster Storage that I was following a few years ago, so I’m also highlighting a few things that have changed since then.

If you think about repeating this installation on your hardware please let me remind you: This software is currently in alpha status. This means there are likely still many bugs and rough edges and if you succeed to install it successfully there is no guarantee for updates not breaking everything again. Please don’t try this anywhere close to production systems or data. I won’t be able to assist you in any way if things turn out badly.

I split this field report into two parts, the first one discussing the GlusterFS storage setup and the second one explaining my challenges when setting up the oVirt self-hosted-engine.

Hypervisor disk layout

I was using a minimal install of a CentOS 8 on a bare-metal server. Make sure you either have two disks or create a separate partition when installing CentOS so that the GlusterFS storage can life on its own block device. My disk layout looks something like this:

[root@loki ~]# lsblk
NAME                    MAJ:MIN RM   SIZE RO TYPE MOUNTPOINT
sda                       8:0    0 931.5G  0 disk 
├─sda1                    8:1    0   100M  0 part 
├─sda2                    8:2    0   256M  0 part /boot
├─sda3                    8:3    0    45G  0 part 
│ ├─vg_loki-slash       253:0    0    10G  0 lvm  /
│ ├─vg_loki-swap        253:1    0     4G  0 lvm  [SWAP]
│ ├─vg_loki-var         253:2    0     5G  0 lvm  /var
│ ├─vg_loki-home        253:3    0     2G  0 lvm  /home
│ └─vg_loki-log         253:4    0     2G  0 lvm  /var/log
└─sda4                    8:4    0   500G  0 part

The CentOS installation is placed on a LVM volume group (vg_loki on /dev/sda3) with some individual volumes for dedicated mount points and then there is /dev/sda4 which is an empty disk partition that will be used by GlusterFS later. If you wonder how to do such a setup with the CentOS 8 installer… I don’t know. I tried for a moment to somehow configure this setup in the installer, but eventually I gave up, manually partitioned the disk and created the volume group and then used the pre-generated setup in the installer which perfectly detected what I was doing on the shell.

Install software requirements

First you need to enable the oVirt 4.4-alpha package repository by installing the corresponding release package:

# dnf install https://resources.ovirt.org/pub/yum-repo/ovirt-release44-pre.rpm

Recently a lot of effort was invested into incorporating the oVirt setup into the Cockpit Web interface and it’s now even the recommended installation method for the downstream Red Hat Virtualization (RHV). When I setup my previous hyperconverged oVirt 4.0 this wasn’t available back then so of course I’m going to try this. To setup Cockpit and the oVirt integration the following packages need to be installed:

# dnf install cockpit cockpit-ovirt-dashboard glusterfs-server

After logging into Cockpit that runs on the hypervisor host on port 9090 there is a dedicated oVirt tab with two entries:

If you continue with the hyperconverged setup, there now even is a dedicated option to install a single node only GlusterFS “cluster”!

This was a big positive surprise to me because the previously used gdeploy tool was insisting on a three node GlusterFS cluster years ago.

Running the GlusterFS wizard

After this revelation the GlusterFS setup is supposedly straight forward. Still I ran into some issues that I could probably have avoided by carefully reading the installation instructions for oVirt 4.3. Nonetheless I’m quickly going to mention a few points here in case other people are struggling with the same and search the Web for these error messages:

  • On the first screen I had an error that the setup cannot proceed because "gluster-ansible-roles is not installed on Host":

    However, the related package including the Ansible roles from gluster-ansible was clearly there:

    # rpm -q gluster-ansible-roles
    gluster-ansible-roles-1.0.5-7.el8.noarch
    

    Eventually I found that my sudo rules for my unprivileged user account are not properly picked up by Cockpit so I restarted the setup by using the root account which then successfully detected the Ansible roles.

  • When selecting the brick setup the “Raid Type” must be changed to “JBOD” and the device name that was reserved for the GlusterFS storage must be entered:Eventually the wizard will create a dedicated LVM volume group for GlusterFS bricks and a LVM thin-pool volume if you wish so:
    # lvs gluster_vg_sda4
      LV                               VG              Attr       LSize    Pool                             Origin Data%  Meta%  Move Log Cpy%Sync Convert
      gluster_lv_data                  gluster_vg_sda4 Vwi-aot---  125.00g gluster_thinpool_gluster_vg_sda4        3.35                                   
      gluster_lv_engine                gluster_vg_sda4 -wi-ao----   75.00g                                                                                
      gluster_lv_vmstore               gluster_vg_sda4 Vwi-aot---  300.00g gluster_thinpool_gluster_vg_sda4        0.05                                   
      gluster_thinpool_gluster_vg_sda4 gluster_vg_sda4 twi-aot--- <421.00g                                         1.03   0.84
  • Before the Ansible playbook that will setup the storage is executed the generated inventory file will be displayed. Because I'm very familiar with Ansible anyway, I love this part! It also makes it easier to understand which playbook command to run when troubleshooting something on the command line where the Cockpit Web interface doesn't make sense to be involved anymore:
    The "Enable Debug Logging" is definitely worth to be enabled especially if you run this the first time on your server. It gives you much more insight in what Ansible is actually doing on your hypervisor.
  • When finally running the "Deploy" step it didn't take long to fail the playbook with the following error:
    TASK [Check if provided hostnames are valid] ***********************************
    task path: /usr/share/cockpit/ovirt-dashboard/ansible/hc_wizard.yml:29
    fatal: [loki.oasis.home]: FAILED! => {"msg": "The conditional check 'result.results[0]['stdout_lines'] > 0' failed. The error was: Unexpected templating type error occurred on ({% if result.results[0]['stdout_lines'] > 0 %} True {% else %} False {% endif %}): '>' not supported between instances of 'list' and 'int'"}
    

    The involved code is untouched since a long time. So I reported the issue at RHBZ #1806298. I'm not sure how this could ever work but the fix is also trivial. After changing the following lines this task was successfully passing:

    --- /usr/share/cockpit/ovirt-dashboard/ansible/hc_wizard.yml.orig       2020-02-18 14:48:33.678471259 +0100
    +++ /usr/share/cockpit/ovirt-dashboard/ansible/hc_wizard.yml    2020-02-18 14:48:55.810456470 +0100
    @@ -30,7 +30,7 @@
           assert:
             that:
               - "result.results[0]['rc'] == 0"
    -          - "result.results[0]['stdout_lines'] > 0"
    +          - "result.results[0]['stdout_lines'] | length > 0"
             fail_msg: "The given hostname is not valid FQDN"
           when: gluster_features_fqdn_check | default(true)

    Btw. the error message can not only be seen in the Web UI but is also written to a log file: /var/log/cockpit/ovirt-dashboard/gluster-deployment.log

  • There was another issue that cost me more effort to track down. The deployment playbook was failing to add the firewalld rules for GlusterFS:
    TASK [gluster.infra/roles/firewall_config : Add/Delete services to firewalld rules] ***
    task path: /etc/ansible/roles/gluster.infra/roles/firewall_config/tasks/main.yml:24
    failed: [loki.oasis.home] (item=glusterfs) => {"ansible_loop_var": "item", "changed": false, "item": "glusterfs", "msg": "ERROR: Exception caught: org.fedoraproject.FirewallD1.Exception: INVALID_SERVICE: 'glusterfs' not among existing services Permanent and Non-Permanent(immediate) operation, Services are defined by port/tcp relationship and named as they are in /etc/services (on most systems)"}

    Indeed firewalld doesn't know about a 'glusterfs' service:

    # rpm -q firewalld
    firewalld-0.7.0-5.el8.noarch
    # firewall-cmd --get-services | grep glusterfs
    #
    

    Is this an old version? From where do I get the 'glusterfs' firewalld service definition? The solution to this is as simple as embarrassing. I found that the service definition is packaged as part of the glusterfs-server RPM which was still missing on my server. After installing it also this issue was solved.

Eventually the deployment succeeded and the CentOS 8 host was converted into a single node GlusterFS storage cluster:

# gluster volume status
Status of volume: data
Gluster process                             TCP Port  RDMA Port  Online  Pid
------------------------------------------------------------------------------
Brick loki.oasis.home:/gluster_bricks/data/
data                                        49153     0          Y       23806
 
Task Status of Volume data
------------------------------------------------------------------------------
There are no active volume tasks
 
Status of volume: engine
Gluster process                             TCP Port  RDMA Port  Online  Pid
------------------------------------------------------------------------------
Brick loki.oasis.home:/gluster_bricks/engin
e/engine                                    49152     0          Y       23527
 
Task Status of Volume engine
------------------------------------------------------------------------------
There are no active volume tasks
 
Status of volume: vmstore
Gluster process                             TCP Port  RDMA Port  Online  Pid
------------------------------------------------------------------------------
Brick loki.oasis.home:/gluster_bricks/vmsto
re/vmstore                                  49154     0          Y       24052
 
Task Status of Volume vmstore
------------------------------------------------------------------------------
There are no active volume tasks

Conclusion

I'm super pleased with the installation experience so far. The new GlusterFS Ansible roles had no issues setting up the bricks and volumes. The Cockpit Web-GUI was easy to use and always clearly communicated what was going on. There is now a supported configuration of a one node hyperconverged oVirt setup which makes me happy too. Kudos to everyone involved with this, great work!

Now let's continue with the oVirt self-hosted engine setup.

Nov 062019
 

My activities in October were mostly related to updating my COPR repositories for CentOS 8 and cleaning up the old repositories:

  • I updated the ganto/jo COPR repository to support CentOS 8.
  • I updated the ganto/vcsh COPR repository to support CentOS 8 and added package builds for the alternative architectures (aarch64 and ppc64le).
  • Thanks to the help of jmontleon I was finally able to build LXD which is available in my ganto/lxc3 repository for CentOS 8. I also updated the RPM for the latest stable release LXD 3.18.
  • After years of development the distrobuilder tool which is meant to replace the shellscript-based LXC templates was tagged in a first 1.0 release that should now also be able to build CentOS 8 container images. Of course I updated the corresponding RPM in the ganto/lxc3 COPR repository accordingly. I’m not sure how they decide to do new releases therefore I might decide to go back building regular git snapshot releases of this tool in the future.
  • I updated the ganto/goaccess COPR repository to support CentOS 8 and also increased the built goaccess version to a git snapshot from May 2019 based on version 1.3. Unfortunately the official Fedora package is still only at version 1.2. I was first testing the latest git snapshot but then found that it is affected by a bug (GitHub issue 1575) which would fail to render the access graphs properly.
  • The last COPR repository pending an update for CentOS 8 is ganto/umoci which still fails because of go-md2man missing from EPEL 8.
  • I deleted some outdated COPR repositories (ganto/lxc, ganto/lxd, ganto/lxdock) and archived the related GitHub repositories holding the RPM spec files.

Then I was also experimenting with adding Debian machines to a CentOS FreeIPA identity management server via Ansible. Years ago I wrote an Ansible role freeipa-client which was able to do that but still required manual setup of the Kerberos keytab on the client machine. I plan to replace that with a collection of new roles trying to blend-in with DebOps as much as possible. But unfortunately nothing ready to show yet.

Finally, as always, I updated a lot of ebuilds in my linuxmonk-overlay Gentoo overlay.

Oct 012019
 

I’m starting a new series of blog posts summarizing my various activities regarding free software projects. There might not be every month something worth mentioning, but this month I was quite busy what might be interesting for some of you.

Following I’ll list some of the activities I was involved regarding free software projects in September:

  • After the official release of CentOS 8, I started rebuilding the packages in my lxc3 COPR repository for CentOS 8. The lxd package is still missing and I’m planning to provide it for CentOS 8 together with the pending update to lxd-3.17. A rebuild of the packages in my various other COPR repositories can be expected in the coming weeks.
  • Being the package maintainer of the spectre-meltdown-checker package in Fedora and EPEL, I followed the instructions to request a package branch for epel-8. This was approved a few hours ago, so the packages is now available via Koji and awaits approval in Bodhi for inclusion into the EPEL testing and eventually stable repository. Please give some karma if you’d like to accelerate this.
  • I merged some pull-requests in the Gentoo go-overlay git repository where the original maintainer entrusted me with commit permissions. Because he didn’t participate since last December, I used the chance to cleanup the repository to pass the repoman checks again and eventually merged a PR for the latest traeffik 1.x (1.7.18) release.
  • I put some effort into packaging the Gnome 3.34 release in my personal Gentoo linuxmonk-overlay. Of course I’m running it on my main workstation on top of Wayland without any major issues so far. Give it a try if you can’t wait for the official ebuilds to be ready.
  • I released version 0.1.2 of my acme-tiny Ansible role which fixes an annoying bug. It could happen that if the certificate renewal was unsuccessful, a still valid certificate would have been overwritten with an empty file. Now the role will make a backup copy of the old certificate by default and validate the new certificate before replacing the old one.
Dec 122018
 

The first thing that someone would need when operating or playing around with OKD (better known as OpenShift) is a git version control service. Personally I’m a fan of Gitea and that’s why I’d like to show a way how to run Gitea in a OpenShift environment. Gitea upstream already provides a great container image which I’m are going to use. But as some of you may have already experienced, running an image on docker and running it in OpenShift is two different pairs of shoes. The fact that the Gitea image runs an integrated SSH server means that it doesn’t simply match the widely discussed Web application pattern. Therefore I’m trying to explain some of the difficulties that one might encounter when moving such an application to OpenShift.

My environment consists of a multi-node OpenShift cluster. Obviously Gitea should be high available so that if a node goes down, one would still be able to access the git repositories. One pod is no pod, so Gitea must be deployed with a replica count of at least two. Accessing the pods over HTTP is already solved by the OpenShift default infrastructure via redundant HAProxy routers. I’d probably explain how to achieve a redundant router setup in one of my next blog posts but this time I’d like to emphasis on the Gitea SSH access via NodePort service feature. The following graphic shows a communication overview of such a setup:

NodePort Service

In OpenShift the Kubernetes Service resource is responsible for directing the traffic (TCP, UDP or SCTP) to the individual application pods. It maps the service name (e.g. ‘gitea’) via SkyDNS to a so-called ClusterIP. This is a virtual IP address that is not assigned to any host or container network interface but still used as packet destination within the cluster SDN (software defined network). After receiving a packet to this so-called ClusterIP the Linux kernel of an OpenShift node rewrites the packet destination to an IP address of an actual application pod and acts as a virtual network load-balancer.

In our example there is a ‘gitea’ service managing the HTTP traffic to port 3000 of the Gitea pod and a ‘gitea-ssh’ service managing the SSH traffic to port 22 of the Gitea pod. Because we can’t use the OpenShift Router as ingress for SSH, the ‘gitea-ssh’ service defines a special type called NodePort. This means that a packet sent to this port (e.g. 30022) on any OpenShift node will be received by the corresponding service and therefore forwarded to a Gitea pod. This is the simplest way how to direct non-HTTP traffic from outside of OpenShift to an application pod and can also be used for e.g. database protocols or Java RMI. Here the corresponding resource definition for the Gitea SSH service:

apiVersion: v1
kind: Service
metadata:
  name: gitea-ssh
spec:
  ports:
    - name: ssh
      nodePort: 30022
      port: 22
      protocol: TCP
      targetPort: 22
  selector:
    app: gitea
    deploymentconfig: gitea
  sessionAffinity: ClientIP
  type: NodePort

The sessionAffinity: ClientIP setting defines “sticky sessions” to avoid distributing multiple requests of the same client to different pods. I didn’t test yet, how SSH would behave without it, but I think it generally makes sense. In a running setup the service additionally shows the discussed ClusterIP which is statically assigned and the endpoints (pod IPs) which may change when pods are started and stopped:

$ oc describe service gitea-ssh
Name:                     gitea-ssh
Namespace:                vcs
Labels:                   app=gitea
                          template=gitea-persistent-template
Annotations:              
Selector:                 app=gitea,deploymentconfig=gitea
Type:                     NodePort
IP:                       172.30.8.9
Port:                     ssh  22/TCP
TargetPort:               22/TCP
NodePort:                 ssh  30022/TCP
Endpoints:                10.129.2.44:22,10.130.3.71:22
Session Affinity:         ClientIP
External Traffic Policy:  Cluster
Events:                   

From within the cluster, the Gitea SSH service can be reached via service name (extended with OpenShift project name, here ‘vcs’) DNS entry or directly via ClusterIP:

$ host gitea-ssh.vcs.svc
gitea-ssh.vcs.svc has address 172.30.8.9

$ ssh git@gitea-ssh.vcs.svc
PTY allocation request failed on channel 0
Hi there, You've successfully authenticated, but Gitea does not provide shell access.
If this is unexpected, please log in with password and setup Gitea under another user.
Connection to gitea-ssh.vcs.svc closed.

From outside the cluster, the Gitea SSH service can be reached via NodePort on any OpenShift node. To avoid a dependency on a single node in the git repository URL you can define multiple DNS entries using the same name (e.g. services.example.com) to all OpenShift node addresses:

$ host services.example.com
services.example.com has address 10.0.0.2
services.example.com has address 10.0.0.3

$ ssh -p 30022 git@services.example.com
PTY allocation request failed on channel 0
Hi there, You've successfully authenticated, but Gitea does not provide shell access.
If this is unexpected, please log in with password and setup Gitea under another user.
Connection to services.example.com closed.

Issues with NodePort

Port Assignment
The NodePort mechanism is allocating the corresponding port on each OpenShift node. To avoid a clash with node services such as the DNS resolver or the OpenShift node service the port range is restricted. It can be configured in the /etc/origin/master/master-config.yml with the option servicesNodePortRange and defaults to 30000-32767. Obviously multiple applications in the same cluster cannot use the same port and traffic to the chosen port must be allowed by the host firewall on the OpenShift nodes.

Node Groups
NodePorts are always allocated on every OpenShift cluster host running the node service which also includes the OpenShift master servers. OpenShift doesn’t provide a way to restrict the involved hosts to a subset. In my example I choose to restrict the hosts receiving traffic by only adding a limited number of nodes to the service DNS entry and block access on the others via iptables. If you don’t use an application load-balancer in front of the OpenShift routers you could also re-use the wildcard DNS entry defined for the HTTP traffic. The NodePort traffic would then follow the same path as the normal Web traffic.

Node Failure
If one OpenShift node goes down a client trying to access the Gitea SSH service might still try to connect to the unreachable host. Fortunately, the default SSH implementation used by the git command line client is quite tolerant and simply retries with another IP address. When testing this case I therefore haven’t experienced a major issue except a slight connection delay. The failure behavior might be different for other git clients or other application protocols altogether and is definitely not ideal but simple instead.

One way to improve this failure scenario would be to add a real TCP load-balancer in front of the NodePort but then there would be another piece of infrastructure that must be managed synchronously with the OpenShift infrastructure and which might be a new single point of failure.

Container with root Permissions

When starting the upstream Gitea container image in OpenShift you might likely encounter a startup failure with the following error message in the log:

s6-svscan: fatal: unable to mkfifo .s6-svscan/control: Permission denied

The Gitea image, and many other docker images not optimized for the pod concept introduced by Kubernetes, doesn’t start a single application process but a supervisor process (in this case s6) which then spawns multiple different application processes defined in /etc/s6. To do so it wants to create a FIFO in the /etc/s6/.s6-svscan directory which is only writable by the root user which fails as by default processes are started with a random unprivileged account.

Security Context Constraints

Unlike docker, OpenShift controls the actions a pod can do and access with a tight set of rules called Security Context Constraints (SCC). By default the ‘default’ ServiceAccount used to run the application pods is a member of the ‘restricted’ SCC which among other things defines the previously mentioned randomized UID. As Gitea won’t work like this, a less restrictive SCC must be used. After reading the documentation we find, that there is already a predefined SCC which grants us just enough permissions to start our container process as root user without weakening too many other restrictions. The SCC we are heading for is ‘anyuid’. Below I’ll present different approaches how this SCC can now be assigned to the Gitea deployment:

  • The OpenShift cluster administrator can add the ‘default’ ServiceAccount of a project to the list of users in the SCC definition. This doesn’t need any special configuration in the DeploymentConfig of the application but also grants every deployment in the corresponding project ‘anyuid’ privileges. In our setup this would be done with the following command, when assuming Gitea should be deployed in the ‘vcs’ project:
    $ oc adm policy add-scc-to-user anyuid system:serviceaccount:vcs:default
    

    I’m not in favor of this approach as it “hides” the additional permissions in the default ServiceAccount and prone to break the principle of least privilege by assigning the SCC to potentially more applications than necessary.

  • Another approach is using a dedicated ServiceAccount for the Gitea deployment and only adding that to the ‘anyuid’ SCC. The project owner can create a ServiceAccount with:
    $ oc create serviceaccount gitea
    

    The cluster administrator then has to add it to the SCC as before:

    $ oc adm policy add-scc-to-user anyuid system:serviceaccount:vcs:gitea
    

    In the DeploymentConfig the ServiceAccount must be referenced with a entry under the spec.template.spec key:

    $ oc patch dc/gitea --patch '{"spec":{"template":{"spec":{"serviceAccountName": "gitea"}}}}'
    

    The dedicated ServiceAccount used in this approach already hints that there might be special privileges connected to it and is in my opinion easier to audit. The disadvantage however is the more complex configuration.

  • Instead of adding every user account individually to the SCC a dedicated user group could be created having the SCC assigned to this group. Individual ServiceAcccountss would then be added to the group and therefore inherit the SCC. This would follow common practice in identity management to assign permissions to users via privilege groups. Additionally a group management role could be created which then would permit dedicated users not having the ‘cluster-admin’ privilege to manage the group membership.
  • Unfortunately I couldn’t figure out a true self-service model where a responsible project admin could expand the necessary permissions without the possibility to interfere with other projects. In the documentation of OpenShift (<=3.7) I found a hint that it is/was(?) possible to extend the default ServiceAccounts available after creating a new project by adding the account name (e.g. ‘anyuid-service-account’) to the serviceAccountConfig.managedNames list in /etc/origin/master/master-config.yml. While this configuration is still present in newer master-config.yml, the documentation is gone and I also didn’t find a way how to automatically add a user created like this to the ‘anyuid’ SCC. Maybe it’s possible by somehow modifying the project template. If you have done this before or at least have an idea how this could be done, please drop me a line.

At the end, the way how the ‘anyuid’ SCC is assigned to the Gitea application is unimportant as long as the application pod is allowed to start the s6 supervisor process with root permissions.

Gitea Application Template

The way how OpenShift administrators can provide an application setup ready for instantiation by OpenShift project owners is through Templates. Inspired by the My journey through Openshift blog post, I wanted to create my own Gitea template fixing some issues found in the original template and extending it with the opinionated configuration presented above. You can download it from here.

The template is able to automatically setup Gitea with exception of the ‘anyuid’ SCC configuration. It requires a persistent volume (PV) for storing the git repositories and some static configurations such as the SSH authorized_keys file. By default it will use a SQLite database backend which is also stored in the PV. Optionally you can also give the connection string and credentials of a PostgreSQL or MariaDB backend which can run on OpenShift or externally.

If you want the template to be available in the Service Catalog the YAML file has to be applied to the ‘openshift’ project by a cluster administrator:

$ oc create -f gitea-persistent-template.yaml -n openshift

Afterwards it can be instantiated by any project admin via Service Catalog Web-UI or from the command line via:

$ oc new-project vcs
$ oc new-app --template=gitea-persistent -p HTTP_DOMAIN=git.example.com -p SSH_DOMAIN=services.example.com

Alternatively, if no Service Catalog is available, or the template shouldn’t be loaded to OpenShift, the application can also be created directly from the YAML file via:

$ oc new-app -f gitea-persistent-template.yaml -p HTTP_DOMAIN=git.example.com -p SSH_DOMAIN=services.example.com

IMPORTANT: The template will configure Gitea to use a ServiceAccount named according to the parameter APPLICATION_NAME (defaults to ‘gitea’). It must be added to the ‘anyuid’ SCC as described above. E.g.:

$ oc adm policy add-scc-to-user anyuid system:serviceaccount:vcs:gitea

If you have some feedback regarding the template or troubles using it, please open a Github issue. Comments, corrections or general feedback to my article can be posted below. Thanks for reading.

Feb 152018
 

The recently disclosed Spectre and Meltdown CPU vulnerabilities are some of the most dramatic security issues in the recent computer history. Fortunately even six weeks after public disclosure sophisticated attacks exploiting these vulnerabilities are not yet common to observe. Fortunately, because the hard- and software vendors are still stuggling to provide appropriate fixes.

If you happen to run a Linux system, an excellent tool for tracking your vulnerability as well as the already active mitigation strategies is the spectre-meltdown-checker script originally written and maintained by Stéphane Lesimple.

Within the last month I set myself the target to bring this script to Fedora and EPEL so it can be easily consumed by the Fedora, CentOS and RHEL users. Today it finally happend that the spectre-meltdown-checker package was added to the EPEL repositories after it is already available in the Fedora stable repositories since one week.

On Fedora, all you need to do is:

dnf install spectre-meltdown-checker

After enabling the EPEL repository on CentOS this would be:

yum install spectre-meltdown-checker

The script, which should be run by the root user, will report:

    • If your processor is affected by the different variants of the Spectre and Meltdown vulnerabilities.
    • If your processor microcode tries to mitigate the Spectre vulnerability or if you run a microcode which
      is known to cause stability issues.
    • If your kernel implements the currently known mitigation strategies and if it was compiled with a compiler which is hardening it even more.
    • And eventually if you’re (still) affected by some of the vulnerability variants.
  • On my laptop this currently looks like this (Note, that I’m not running the latest stable Fedora kernel yet):

    # spectre-meltdown-checker                                                                                                                                
    Spectre and Meltdown mitigation detection tool v0.33                                                                                                                      
                                                                                                                                                                              
    Checking for vulnerabilities on current system                                       
    Kernel is Linux 4.14.14-200.fc26.x86_64 #1 SMP Fri Jan 19 13:27:06 UTC 2018 x86_64   
    CPU is Intel(R) Core(TM) i5-5200U CPU @ 2.20GHz                                      
                                                                                                                                                                              
    Hardware check                            
    * Hardware support (CPU microcode) for mitigation techniques                         
      * Indirect Branch Restricted Speculation (IBRS)                                    
        * SPEC_CTRL MSR is available:  YES    
        * CPU indicates IBRS capability:  YES  (SPEC_CTRL feature bit)                   
      * Indirect Branch Prediction Barrier (IBPB)                                        
        * PRED_CMD MSR is available:  YES     
        * CPU indicates IBPB capability:  YES  (SPEC_CTRL feature bit)                   
      * Single Thread Indirect Branch Predictors (STIBP)                                                                                                                      
        * SPEC_CTRL MSR is available:  YES    
        * CPU indicates STIBP capability:  YES                                           
      * Enhanced IBRS (IBRS_ALL)              
        * CPU indicates ARCH_CAPABILITIES MSR availability:  NO                          
        * ARCH_CAPABILITIES MSR advertises IBRS_ALL capability:  NO                                                                                                           
      * CPU explicitly indicates not being vulnerable to Meltdown (RDCL_NO):  UNKNOWN    
      * CPU microcode is known to cause stability problems:  YES  (Intel CPU Family 6 Model 61 Stepping 4 with microcode 0x28)                                                
                                              
    The microcode your CPU is running on is known to cause instability problems,         
    such as intempestive reboots or random crashes.                                      
    You are advised to either revert to a previous microcode version (that might not have
    the mitigations for Spectre), or upgrade to a newer one if available.                
    
    * CPU vulnerability to the three speculative execution attacks variants
      * Vulnerable to Variant 1:  YES 
      * Vulnerable to Variant 2:  YES 
      * Vulnerable to Variant 3:  YES 
    
    CVE-2017-5753 [bounds check bypass] aka 'Spectre Variant 1'
    * Mitigated according to the /sys interface:  NO  (kernel confirms your system is vulnerable)
    > STATUS:  VULNERABLE  (Vulnerable)
    
    CVE-2017-5715 [branch target injection] aka 'Spectre Variant 2'
    * Mitigated according to the /sys interface:  YES  (kernel confirms that the mitigation is active)
    * Mitigation 1
      * Kernel is compiled with IBRS/IBPB support:  NO 
      * Currently enabled features
        * IBRS enabled for Kernel space:  NO 
        * IBRS enabled for User space:  NO 
        * IBPB enabled:  NO 
    * Mitigation 2
      * Kernel compiled with retpoline option:  YES 
      * Kernel compiled with a retpoline-aware compiler:  YES  (kernel reports full retpoline compilation)
      * Retpoline enabled:  YES 
    > STATUS:  NOT VULNERABLE  (Mitigation: Full generic retpoline)
    
    CVE-2017-5754 [rogue data cache load] aka 'Meltdown' aka 'Variant 3'
    * Mitigated according to the /sys interface:  YES  (kernel confirms that the mitigation is active)
    * Kernel supports Page Table Isolation (PTI):  YES 
    * PTI enabled and active:  YES 
    * Running as a Xen PV DomU:  NO 
    > STATUS:  NOT VULNERABLE  (Mitigation: PTI)
    
    A false sense of security is worse than no security at all, see --disclaimer
    

    The script also supports a mode which outputs the result as JSON, so that it can easily be parsed by any compliance or monitoring tool:

    # spectre-meltdown-checker --batch json 2>/dev/null | jq
    [
      {
        "NAME": "SPECTRE VARIANT 1",
        "CVE": "CVE-2017-5753",
        "VULNERABLE": true,
        "INFOS": "Vulnerable"
      },
      {
        "NAME": "SPECTRE VARIANT 2",
        "CVE": "CVE-2017-5715",
        "VULNERABLE": false,
        "INFOS": "Mitigation: Full generic retpoline"
      },
      {
        "NAME": "MELTDOWN",
        "CVE": "CVE-2017-5754",
        "VULNERABLE": false,
        "INFOS": "Mitigation: PTI"
      }
    ]
    

    For those who are (still) using a Nagios-compatible monitoring system, spectre-meltdown-checker also supports to be run as NRPE check:

    # spectre-meltdown-checker --batch nrpe 2>/dev/null ; echo $?
    Vulnerable: CVE-2017-5753
    2
    

    I just mailed to Stéphane and he will soon release version 0.35 with many new features and fixes. As soon as it will be released I’ll submit a package update, so that you’re always up to date with the latest developments.

    Dec 202016
     

    Since a long time I’m using and following the development of the LXC (Linux Container) project. I feel that it unfortunately never really had the success it deserved and in the recent years new technologies such as Docker and rkt pretty much redefined the common understanding of a container according to their own terms. Nonetheless LXC still claims its niche as full Linux operating system container solution especially suited for persistent pet containers, an area where the new players on the market are still in the stage of figuring out how to implement this properly according to their concept. LXC development hasn’t stalled, quite the contrary, they extended the API with a HTTP REST interface (served via Linux Container Daemon, LXD), implemented support for container live-migration, added container image management and much more. This means that there are a lot of reasons why someone, including me, would want to use Linux containers and LXD.

    Enable LXD COPR repository
    LXD is not officially packaged for Fedora. Therefore I spent the last few weeks by creating some community packages via their COPR build system and repository service. Similar to the better known Ubuntu PPA (Personal Package Archive) system, COPR provides a RPM package repository which can easily be consumed by Fedora users. To use the LXD repository, all you need to do is enabling it via dnf:

    # dnf copr enable ganto/lxd
    

    Please note that COPR packages are not reviewed by the Fedora package maintainers therefore you should only install packages where you trust the author. For this reason I also provide a Github repository with the RPM spec files, so that everyone could also build the RPMs on their own if they feel uncomfortable using the pre-built RPMs from the repository.

    Install and start LXD
    LXD is split into multiple packages. The important ones are lxd, the Linux Container Daemon and lxd-client, the LXD client binary called lxc. Install them with:

    # dnf install lxd lxd-client
    

    Unfortunately I didn’t had time to figure out the correct SELinux labels for LXD yet, therefore you need to disable SELinux prior to starting the daemon. LXD supports user namespaces to map the root user in a container to an unprivileged user ID on the container host. For this you need to assign an UID range on the host:

    # echo "root:1000000:65536" >> /etc/subuid
    # echo "root:1000000:65536" >> /etc/subgid
    

    If you don’t do this, user namespaces won’t be used which is indicated by a message such as:

    lvl=warn msg="Error reading idmap" err="User \"root\" has no subuids."
    lvl=warn msg="Only privileged containers will be able to run"
    

    Eventually start LXD with:

    # systemctl start lxd.service
    

    LXD configuration
    LXD doesn’t have a configuration file. Configuration properties must be set and retrieved via client commands. Here you can find a list of all supported configuration properties. Most tutorials will suggest to initially run lxd init which would generate a basic configuration. However there is only a limited set of configuration options available via this command and therefore I prefer to set the properties via LXD client. A normal user account can be used to manage LXD via client when it’s a member of the lxd POSIX group:

    # usermod --append --groups lxd myuser
    

    By default LXD will store its images and containers in directories under /var/lib/lxd. Alternatives storage back-ends such as LVM, Btrfs or ZFS are available. Here I will show an example how to use LVM. Similar to the recommended Docker setup on Fedora it will use LVM thin volumes to store images and containers. First create a LVM thin pool. For this we still need some space available on the default volume group. Alternatively you can use a second disk with a dedicated volume group. Replace vg00 with the volume group name you want to use:

    # lvcreate --size 20G --type thin-pool --name lxd-pool vg00
    

    Now we set this thin pool as storage back-end in LXD:

    $ lxc config set storage.lvm_vg_name vg00
    $ lxc config set storage.lvm_thinpool_name lxd-pool
    

    For each image which is downloaded LXD will create a thin volume storing the image. If a new container is instantiated a new writeable snapshot will be created from which you can create an image again or make further snapshots for fast roll-back. By default the container file system will be ext4. If you prefer XFS, it can be set with the following command:

    $ lxc config set storage.lvm_fstype xfs
    

    Also for networking various options are available. If you ran lxd init, you may have already created a lxdbr0 network bridge. Otherwise I will show you how to manually create one in case you want a dedicated container bridge or attach LXD to an already existing bridge which would be configured through an external DHCP server.

    To create a dedicated network bridge where the traffic will be NAT‘ed to the outside, run:

    $ lxc network create lxdbr0
    

    This will create a bridge device with the given name and also start-up a dedicated instance of dnsmasq which will act as DNS and DHCP server for the container network.

    A big advantage of LXD in comparison to plain LXC is a feature called container profiles. There you can define settings which should be applied to a new container instance. In our case, we now want containers to use the network bridge created before or any other network bridge which was created independently. For this it will be added to the “default” profile which is applied by default when creating a new container:

    $ lxc network attach-profile lxdbr0 default eth0
    

    The eth0 is the network device name which will be used inside the container. We could also add multiple network bridges or create multiple profiles (lxc profile create newprofile) with different network settings.

    Create a container
    Finally we have the most important pieces together to launch a container. A container is always instantiated from an image. The LXC projects provides an image repository with a big number of prebuilt container images pre-configured under the remote name images:. The images are regular LXC containers created via upstream lxc-create script using the various distribution templates. To list the available images run:

    $ lxc image list images:
    

    If you found an image you want to run, it can be started as following. Of course in my example I will use a Fedora 24 container (unfortunately there are no Fedora 25 containers available yet, but I’m also working on that):

    $ lxc launch images:fedora/24 my-fedora-container
    

    With the following command you can create a console session into the container:

    $ lxc exec my-fedora-container /bin/bash
    

    I hope this short guide made you curious to try LXD on Fedora. I’m glad to hear some feedback via comments or Email if you find this guide or the my COPR repository useful or if you have some corrections or found some issues.

    Further reading
    If you want to know more about how to use the individual features of LXD, I can recommend the how-to series of Stéphane Graber, one of the core developers of LXC/LXD:

    Apr 212016
     

    I recently had the task to setup and test a new Linux Internet gateway host as a replacement to an existing router. The setup is classical with some individual ports such as HTTP being forwarded with DNAT to some backend systems.

    Redundant router setup requiring policy routing

    Redundant router setup requiring policy routing

    The new router, from now on I will call it router #2, should be tested and put into operation without downtime. Obviously this means that I had to run the two routers in parallel for a while. The backend systems however, only know one default gateway. Accessing a service through a forwarded port on router #2 resulted in a timeout, as the backend system sent the replies to the wrong gateway where they were dropped.

    Fortunately iptables and iproute2 came to my rescue. They enable you to implement policy routing on Linux. This means that the routing decision is not (only) made based on the destination address of a packet as in regular routing, but additional rules are evaluated. In my case: Every connection opened through router #2 has to be replied via router #2.

    Using iptables/iproute2 for this task this means: Incoming packets with the source MAC address from router #2 are marked with help of the iptables ‘mark’ extension. The iptables ‘connmark’ extension will then help to associate outgoing packets to the previously marked connection. Based on the mark of the outgoing packet a custom routing policy will set the default gateway to router #2. Easy, eh?

    Configuration
    Now I’ll show some commands how this can be accomplished. The following commands assume that the iptables rule set is still empty and are for demonstration purpose only. Likely they have to be adjusted slightly in a real configuration.

    First the routing policy will be setup:

    1. Define a custom routing table. There exist some default tables, so the custom entry shouldn’t overlap with those. For better understanding I will call it ‘router2’:

      # echo "200 router2" >> /etc/iproute2/rt_tables

    2. Add a rule to define the condition which packets should lookup the routing in the previously created table ‘router2’:
      &nbps;
      # ip rule add fwmark 0x2 lookup router2

      This means that IP packets with the mark ‘2’ will be routed according to the table ‘router2’.

    3. Set the default gateway in the ‘router2’ table to the IP address of router #2 (e.g. 10.0.0.2):

      # ip route add default via 10.0.0.2 table router2

    4. To make sure the routing cache is rebuilt, it need to be flushed after changes:
      # ip route flush cache

    Afterwards I had to make sure that the involved connections coming from router #2 are marked appropriately (above the mark ‘2’ was used). The ‘mangle’ table is a part of the Linux iptables packet filter and meant for modifying network packets. This is the place where the packet markings will be set.

    1. The first iptables rule will match all packets belonging to a new connection coming from router #2 and sets the previously defined mark ‘2’:

      # iptables --table mangle --append INPUT \
      --protocol tcp --dport 80 \
      --match state --state NEW \
      --match mac --mac-source 52:54:00:c2:a5:43 \
      ! --source 10.0.0.0/24 \
      --jump MARK --set-mark 0x2

      The packets being marked are restricted to meet the following requirements:

      • being sent by the network adapter of router #2 (--mac-source)
      • don’t originate in the local network (! --source)
      • target destination port 80 (--dport: example for the HTTP port being forwarded by router #2)
      • belong to a new connection (--state NEW)

      Of course additional (or less) extensions can be used to filter the packets according to individual requirements.

    2. Next, the incoming packets are given to the ‘connmark’ extension which will do the connection tracking of the marked connections:

      # iptables --table mangle --append INPUT \
      --jump CONNMARK --save-mark

    3. The packets which can be associated with an existing connection are also marked accordingly:

      # iptables --table mangle --append INPUT \
      --match state --state ESTABLISHED,RELATED \
      --jump CONNMARK --restore-mark

    4. All the previous rules where required that the outgoing packets can finally be marked too:

      # iptables --table mangle --append OUTPUT \
      --jump CONNMARK --restore-mark

    Debugging
    The following commands and iptables rules should help when setting up and/or debugging policy routing with marked packets:

    • List policy of routing table ‘table2’:

      # ip route show table router2

    • List defined routing tables:

      # cat /etc/iproute2/rt_tables

    • Log marked incoming/outgoing packets to syslog:

      # iptables -A INPUT -m mark --mark 0x2 -j LOG
      # iptables -A OUTPUT -m mark --mark 0x2 -j LOG

    Dec 032015
     

    SuperMicro server mainboards often include a dedicated Baseband Management Controller (BMC) which offers out-of-band management of the server system. This is a dedicated embedded chip (Specifications) which allow to power cycle the machine, monitor hardware variables, update firmware, access the operating system console and much more. If you are used to big brand server systems, then you might be more familiar with the term iLO, which is the HP Integrated Lights-Out, or IMM, which is the IBM Integrated Management Module. The basic functionality is always comparable.

    FreeIPMI Management Utility

    A nice fact is, that most of these out-of-band management solutions support the Intelligent Platform Management Interface (IPMI) specification, which defines an interface for accessing the various functionalities from an operating system (OS) or the network (e.g. for monitoring or OS recovery). For Linux there exists GNU FreeIPMI which is a collection of powerful tools for accessing IPMI-compatible BMCs. It is available via default package manager on all major Linux distributions.

    Linux Kernel Configuration
    As mentioned before, on Linux there are two different ways to access the BMC via IPMI. The first way is directly from the host running on the board connected to the BMC. The connection is done via kernel modules. Make sure you have at least the ipmi_defintf and ipmi_si modules loaded. If your kernel doesn’t include this modules, you might need to add them to your kernel configuration. The corresponding settings can be found under:

    Device Drivers --->
       Character Devices --->
          <M> IPMI top-level message handler --->
              [ ]   Generate a panic event to all BMCs on a panic (NEW)
              <M>   Device interface for IPMI (NEW)
              <M>   IPMI System Interface handler (NEW)
              <M>   IPMI SMBus handler (SSIF) (NEW)
              <M>   IPMI Watchdog Timer (NEW)
              <M>   IPMI Poweroff (NEW)
    

    You can check if it’s working by invoking ipmi-detect which should then output something like this:

    # ipmi-locate
    Probing KCS device using DMIDECODE... done
    IPMI Version: 2.0
    IPMI locate driver: DMIDECODE
    IPMI interface: KCS
    BMC driver device: 
    BMC I/O base address: 0xCA2
    Register spacing: 1
    
    Probing SMIC device using DMIDECODE... FAILED
    
    Probing BT device using DMIDECODE... FAILED
    
    Probing SSIF device using DMIDECODE... FAILED
    
    Probing KCS device using SMBIOS... done
    IPMI Version: 2.0
    IPMI locate driver: SMBIOS
    IPMI interface: KCS
    BMC driver device: 
    BMC I/O base address: 0xCA2
    Register spacing: 1
    
    Probing SMIC device using SMBIOS... FAILED
    
    Probing BT device using SMBIOS... FAILED
    
    Probing SSIF device using SMBIOS... FAILED
    
    [...]
    

    There was an IPMI 2.0 compatible chip found, so we are good to go.

    Network Configuration
    The second way to connect via IPMI to the BMC is over the network. For this, there often is a dedicated network port on the mainboard that obviously needs to be connected to a network switch over which you can access it. By default the SuperMicro BMC is configured to get an IP address via DHCP. If the local IPMI connection is working, you can get the IP address by executing:

    # ipmi-config --checkout --section Lan_Conf
    
    #
    # Section Lan_Conf Comments 
    #
    # In the Lan_Conf section, typical networking configuration is setup. Most users 
    # will choose to set "Static" for the "IP_Address_Source" and set the 
    # appropriate "IP_Address", "MAC_Address", "Subnet_Mask", etc. for the machine. 
    #
    Section Lan_Conf
            ## Possible values: Unspecified/Static/Use_DHCP/Use_BIOS/Use_Others
            IP_Address_Source                             Use_DHCP
            ## Give valid IP address
            IP_Address                                    192.168.1.15
            ## Give valid MAC address
            MAC_Address                                   0C:C4:7A:73:18:4F
            ## Give valid Subnet Mask
            Subnet_Mask                                   255.255.255.0
            ## Give valid IP address
            Default_Gateway_IP_Address                    192.168.1.1
            ## Give valid MAC address
            Default_Gateway_MAC_Address                   00:0D:B9:22:15:A2
            ## Give valid IP address
            Backup_Gateway_IP_Address                     0.0.0.0
            ## Give valid MAC address
            Backup_Gateway_MAC_Address                    00:00:00:00:00:00
    EndSection
    

    Otherwise you might need to search the DHCP server log for an entry, which IP address was given to the BMC. I recommend to set the BMC IP address to a fixed value, to minimize the risk to loose connectivity in case of major data center issue. This can be done via Web interface at e.g. https://192.168.1.15 or via ipmi-config:

    # ipmi-config --commit -e Lan_Conf:IP_Address_Source=Static
    # ipmi-config --commit -e Lan_Conf:IP_Address=192.168.1.42
    

    Alternatively you can write the configuration in file and commit it with the --filename argument. E.g. create a static-network.conf:

    # Static network configuration for the BMC
    Section Lan_Conf
            IP_Address_Source                             Static
            IP_Address                                    192.168.1.42
    EndSection
    

    Unfortunately the IP_Address_Source key cannot be changed concurrently with other Lan_Conf keys. So we had to run the commit command twice, when specifying the new values on the command line and the same is true with the configuration file option. The first time it will set the IP_Address_Source:

    # ipmi-config --commit --filename=static-network.conf
    

    And the second time, it will set the new IP_address:

    # ipmi-config --commit --filename=static-network.conf
    

    However, this is an exception and most other key/value pairs can be changed concurrently. See the ipmi-config(8) man-page for more details.

    Eventually we can check if the IPMI interface is reachable via network. This can be done with the ipmi-ping tool. If the --verbose argument is added, it will even output some information about the configured authentication settings. E.g.:

    # ipmi-ping --count 1 --verbose 192.168.1.42
    ipmi-ping 192.168.1.42 (192.168.1.42)
    response received from 192.168.1.42: rq_seq=23, auth: none=clear md2=set md5=set password=set oem=clear anon=clear null=clear non-null=set user=clear permsg=clear 
    --- ipmi-ping 192.168.1.42 statistics ---
    1 requests transmitted, 1 responses received in time, 0.0% packet loss
    
    Configure Serial-over-LAN (SoL) Console Access

    A neat feature of a BMC is the ability to remotely access the Linux console even when the regular network connection to the server is not working any more. However, this needs some additional configuration in the operating system.

    Check SoL Settings in BIOS
    First, we will check the BIOS settings to make sure the SoL feature is enabled. Note that accessing the BIOS usually already works in the default configuration, so if you are adventurous, you can already connect over remote IPMI (for demonstration purpose I’ll use the default user ADMIN):

    $ ipmi-console -h 192.168.1.42 -u ADMIN -P
    

    By default you won’t have access to the Linux system yet, so reboot the system via SSH so the BIOS can be setup accordingly. Unfortunately, the IPMI console won’t show the system’s POST output, so you have to keep pressing the DEL button in the terminal with the open IPMI console until you see the BIOS main screen. Then go to Advanced -> Serial Port Console Redirection and make sure, the SOL Console Redirection is enabled. Also remember how many additional serial ports you have available for configuration in this menu. This will become important when selecting the correct console in the Linux configuration. E.g. my board only has one other serial port (COM1) available and for this one console redirection one mustn’t be enabled for SoL to work correctly.

    SuperMicro BIOS settings accessed via ipmi-console

    SuperMicro BIOS settings accessed via ipmi-console

    If you want to see more verbose POST output, also disable Quiet Boot in the Advanced -> Boot Feature menu.

    Leave the BIOS by pressing Save Changes and Reset. After a short while you should be greeted by the Grub menu. However, there won’t be any more output, as Linux doesn’t know yet, where to connect to the SoL console. To exit the IPMI console, you have to press &..

    Setup Serial Console in Linux
    If you have a systemd-based distribution all you need to do is to modify the kernel command line and add a serial console. Edit /etc/default/grub and extend the GRUB_CMDLINE_LINUX variable as following:

    GRUB_CMDLINE_LINUX="rd.lvm.lv=vg00/swap rd.lvm.lv=vg00/slash rhgb quiet console=tty0 console=ttyS1,115200n8"
    

    Important: This has to be /dev/ttyS1 in case the BIOS knows only knows one additional serial port (which would correspond to /dev/ttyS0). If you have two additional serial ports in the BIOS (COM1/COM2), you must set /dev/ttyS2 here. Don’t configure Grub 2 to output itself to the serial console, as this is still handled by the default SoL configuration forwarding the initial system output.

    Regenerate the grub.cfg with:

    # grub2-mkconfig -o /boot/grub2/grub.cfg
    

    You might need to adjust the command and grub.cfg path according to your installation. The next time when the system is booted, the Linux system output will be available on the serial terminal and there will also be a login prompt. If you don’t have a systemd-based system, you additionally need to enable the serial console login terminal in the /etc/inittab. E.g.:

    T1:23:respawn:/sbin/getty -L ttyS1 115200 vt100
    
    Remotely Manage the System over IPMI

    Now everything we need is in place. We can independently from the Linux operating system or the local system console:

    1. Configure the BMC via ipmi-config (see above)
    2. Access the Linux console via ipmi-console
    3. Query system sensor values (temperatures, voltages, …) via ipmi-sensors
    4. Query system event log via ipmi-sel
    5. Initiate system startup and power reset via ipmi-power

    Even tough I have the latest available IPMI firmware installed, it sometimes happened to me, that the SoL wouldn’t properly connect to the Linux console any more after I disconnected when being in the BIOS. Or that I could navigate through the BIOS but it wouldn’t refresh the screen. Unfortunately the only way that I found to fix this, was to reboot the BMC. Of course also this is possible over IPMI:

    $ bmc-device -h 192.168.1.42 -u ADMIN -P --cold-reset
    

    There are many other things that you can do via IPMI. Also there are other tools which can access IPMI-enabled BMCs. Another famous one is ipmitool. You might want to checkout Adam Sweet’s wiki on IPMI on Linux for more details how to use ipmitool. Personally, I prefer FreeIPMI for being a GNU project, being very intuitive to use and so far it worked perfectly well for everything I needed.

    If you have some hints or additions, please leave a comment below. Thanks for reading.

    Dec 012015
     

    I recently had the challenge to migrate a physical host running Debian, installed on a ancient 32bit machine with a software RAID 1, to a virtual machine (VM). The migration should be as simple as possible so I decided to attach the original disks to the virtualization host and define a new VM which would boot from these disks. This doesn’t sound too complicated but it still included some steps which I was not so familiar with, so I write them down here for later reference. As an experiment I tried the migration on a KVM and a Xen host.

    Prepare original host for virtualized environment

    Enable virtualized disk drivers
    The host I wanted to migrate was running a Debian Jessie i686 installation on bare metal hardware. For booting it uses an initramfs which loads the required disk controller drivers. By default the initramfs only includes the drivers for the current hardware, so the paravirtualization drivers for KVM (virtio-blk) or Xen (xen-blkfront) are missing. This can be changed by adjusting the /etc/initramfs-tools/conf.d/driver-policy file to state that not the currently dependent (dep) modules should be loaded, but most:

    # Driver inclusion policy selected during installation
    # Note: this setting overrides the value set in the file
    # /etc/initramfs-tools/initramfs.conf
    MODULES=most
    

    Afterwards the initramfs must be rebuilt by running the following command (adjust the kernel version according to the kernel you are running):

    # dpkg-reconfigure linux-image-3.16.0-4-686-pae
    

    Now the initramfs contains all required modules to successfully boot the host from a KVM virtio or a Xen blockfront disk device. This can be checked with:

    # lsinitramfs /boot/initrd.img-3.16.0-4-686-pae | egrep -i "(xen|virtio).*blk.*\.ko"
    lib/modules/3.16.0-4-686-pae/kernel/drivers/block/virtio_blk.ko
    lib/modules/3.16.0-4-686-pae/kernel/drivers/block/xen-blkback/xen-blkback.ko
    lib/modules/3.16.0-4-686-pae/kernel/drivers/block/xen-blkfront.ko
    

    Enable serial console
    To easily access the server console from the virtualization host, it’s required to setup a serial console in the guest, which must be defined in /etc/default/grub:

    [...]
    GRUB_CMDLINE_LINUX="console=tty0 console=ttyS0,115200n8"
    GRUB_SERIAL_COMMAND="serial --unit=0 --speed=115200 --word=8 --parity=no --stop=1"
    [...]
    # Uncomment to disable graphical terminal (grub-pc only)
    GRUB_TERMINAL="console serial"
    

    After regenerating the Grub configuration, the boot loader and local console will then also be accessible via virsh console:

    # grub-mkconfig -o /boot/grub/grub.cfg
    
    Run the host on a KVM hypervisor

    KVM is nowadays the de-facto default virtualization solution for running Linux on Linux and is very well integrated in all major distributions and a wide range of management tools. Therefore it’s really simple to boot the disks into a KVM VM:

    • Make sure the disks are not already assembled as md-device on the KVM host. I did this by uninstalling the mdadm utility.
    • Run the following virt-install command to define and start the VM:
      # virt-install --connect qemu:///system --name myhost --memory 1024 --vcpus 2 --cpu host --os-variant debian7 --arch i686 --import --disk /dev/disk/by-id/ata-WDC_WD10EFRX-68PJCN0_WD-WCC4J4527214 --disk /dev/disk/by-id/ata-WDC_WD10EFRX-68PJCN0_WD-WCC4J4366412 --network bridge=virbr0 --graphics=none

    To avoid confusion with the disk enumeration of the KVM host kernel, the disk devices are given as unique device paths instead of e.g. /dev/sdb and /dev/sdc. This clearly identifies the two disk devices which will then be assembled to a RAID 1 by the guest kernel.

    Run the host on a Xen hypervisor

    Xen has been a topic in this blog a few times before as I’m still using it since its early days. After a long time of major code refactorings it also made huge steps forward within the last few years, so that nowadays it’s nearly as easy to setup as KVM and again well supported in the large distributions. Because its architecture is a bit different and Linux is not the only supported platform some things work not quite the same as under KVM. Let’s find out…

    Prepare Xen Grub bootloader
    Xen virtual machines can be booted in various different ways, also depending whether the guest disk is running on an emulated disk controller or as paravirtualized disk. In simple cases, this is done with help of PyGrub loading a Grub Legacy grub.conf or a Grub 2 grub.cfg from a guests /boot partition. As my grub.cfg and kernel is “hidden” in a RAID 1 a fully featured Grub 2 is required. It is perfectly able to load its configuration from advanced disk setups such as RAID arrays, LVM volumes and more. With Xen such a setup is only possible when using a dedicated boot loader disk image which must be in the target architecture of the virtual machine. As I want to run a 32bit virtual machine, a i386-xen Grub 2 flavor needs to be compiled as basis for the boot loader image:

    • Clone the Grub 2 source code:
      $ git clone git://git.savannah.gnu.org/grub.git
    • Configure and build the source code. I was running the following commands on a Gentoo Xen server without issues. On other distributions you might need to install some development packages first:
      $ cd grub
      $ ./autogen.sh
      $ ./configure --target=i386 --with-platform=xen
      $ make -j3
    • Prepare a grub.cfg for the Grub image. The Grub 2 from the Debian guest host was installed on a mirrored boot disk called /dev/md0 which was mounted to /boot. Therefore the Grub image must be hinted to load the actual configuration from there:
      # grub.cfg for Xen Grub image grub-md0-i386-xen.img
      normal (md/0)/grub/grub.cfg
    • Create the Grub image using the previously compiled Grub modules:
      # grub-mkimage -O i386-xen -c grub.cfg -o /var/lib/libvirt/images/grub-md0-i386-xen.img -d ~user/grub/grub-core ~user/grub/grub-core/*.mod

    A more generic guide about generating Xen Grub images can be found at Using Grub 2 as a bootloader for Xen PV guests.

    Define the virtual machine
    virt-install can also be used to import disk (images) as Xen virtual machines. This works perfectly fine for e.g. importing Atomic Host raw images, but unfortunately the setup now is a bit more complicated. It requires me to specify the custom Grub 2 image as guest kernel for which I couldn’t find a corresponding virt-install argument (using v1.3.0). Therefore I first created a plain Xen xl configuration file and then converted it to a libvirt XML file. The initial configuration /etc/xen/myhost.cfg looks as following:

    name = "myhost"
    kernel = "/var/lib/libvirt/images/grub-md0-i386-xen.img"
    memory = 1024
    vcpus = 2
    vif = [ 'bridge=virbr0' ]
    disk = [ '/dev/disk/by-id/ata-WDC_WD10EFRX-68PJCN0_WD-WCC4J4527214,raw,xvda,rw', '/dev/disk/by-id/ata-WDC_WD10EFRX-68PJCN0_WD-WCC4J4366412,raw,xvdb,rw' ]
    

    Eventually this configuration can be converted to a libvirt domain XML with the following command:

    # virsh domxml-from-native --format xen-xl --config /etc/xen/myhost.cfg > /etc/libvirt/libxl/myhost.xml
    # virsh --connect xen:/// define /etc/libvirt/libxl/myhost.xml
    
    Summary

    At the end, I successfully converted the bare metal host to a KVM and/or Xen virtual machine. Once again Xen ended up being a bit more troublesome, but no nasty hacks were required and both configurations were quite straight forward. The boot loader setup for Xen could definitely be a bit simpler, but still it’s nice to see how well Grub 2 and Xen play together now. It’s also pleasing to see, that no virtualization specific configurations had to be made within the guest installation. The fact that the disk device names were changing from /dev/sd[ab] (bare metal) to /dev/vd[ab] (KVM) and /dev/xvd[ab] (Xen) was completely absorbed by the mdadm layer, but even without software RAID the /etc/fstab entries are nowadays generated by the installers in a way, that such migrations are easy possible.

    Thanks for reading. If you have some comments, don’t hesitate to write a note below.